
- 5th Mar 2024
- 06:03 am
Hypothesis testing is an important element of statistics that assists researchers and analysts in involving sound decision and deriving inference out of data. Regardless of your current profession as a student, researcher or data professional, discovering how to conduct your hypothesis testing appropriately can go a long way towards how you know and utilise the data.
This tutorial explains the fundamental concepts, procedures, and techniques applied in hypothesis testing and specifically the use of statistical software to make the task easier.
I. What is Hypothesis Testing?
Hypothesis testing is a way of drawing conclusions about a larger group (population) with the help of a smaller part (sample). You begin by setting up two competing ideas:
- Null Hypothesis: It is an assumption that makes no difference, and it is simply the default assumption.
- Alternative Hypothesis: This implies that an effect or a difference exists--it departs with the null.
Significance Levels:
During testing you also select a significance level (alpha, a) which assists in determining whether the outcomes are enough to discard the null hypothesis. The most common alpha values are 0.05 or 0.01, which is the risk of making a wrong decision of 5% or 1%.
II. Steps Involved in Hypothesis Testing
- Formulate Hypotheses:
- Begin by establishing the null and alternative hypothesis in a clear way depending on your research question.
- Make a decision as to whether your test will be two sided (testing for any difference) or one sided which is a one-tailed (testing in one direction).
- Select the Right Test Statistic: The test you choose depends on the type of data and your research aim:
- T-tests: Can be used to compare means (e.g. between two groups).
- Chi-square tests: The analysis used when comparing means of more than two groups.
- ANOVA: Used when comparing means across more than two groups.
- Set the Significance Level: You select your level of alpha (a) which typically is 0.05 or 0.01, leaving it to the extent you are comfortable with uncertainty.
- Collect and Explore the Data: Expand your data by use of statistical software in collecting, organizing and exploring it. Some initial analysis could be done quickly enough to identify any problems or trends prior to testing.
- Run the Calculations: Apply your chosen statistical test using the software. Most tools handle calculations automatically and reduce the chances of errors.
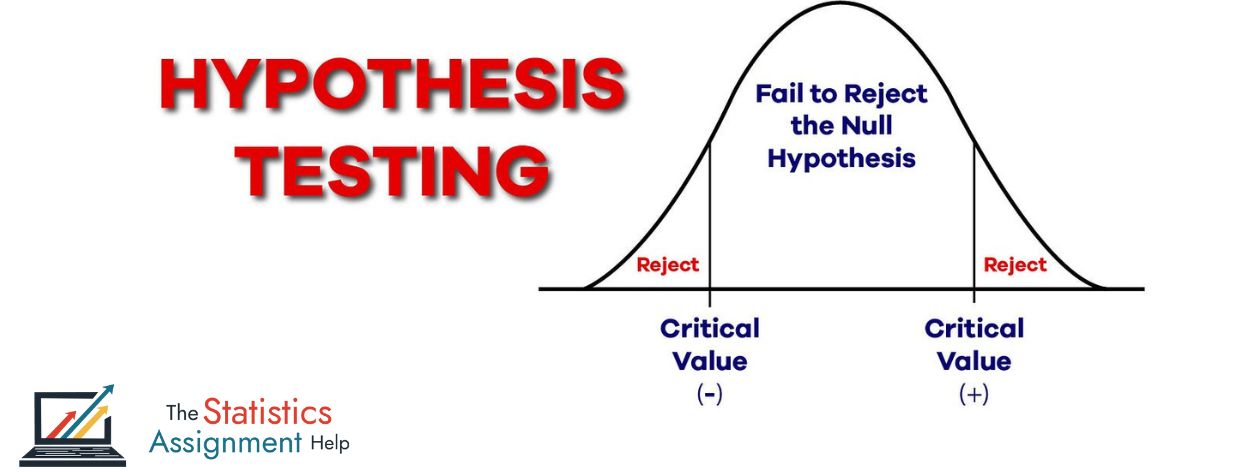
- Make Your Decision: Compare your test result (test statistic) with a critical value or use the p-value. Based on this, decide whether to reject or fail to reject the null hypothesis.
III. Common Hypothesis Tests and When to Use Them
Z-tests and T-tests:
- Z-tests work best with large samples or when the population variance is known.
- T-tests are used when the sample size is small or population variance is unknown.
Chi-Square Tests:
- Often used for categorical data.
- Helps test relationships between variables or check how well data fits expected patterns.
ANOVA (Analysis of Variance):
- Useful when comparing more than two group means.
- Statistical software also supports post-hoc tests to see which groups differ.
IV. Real-World Applications
- In Medical Studies:
Hypothesis testing assists researchers in making a comparison of novel treatments and traditional ones. Clinical data could be discussed in significant amounts by using software.
- In Marketing Research:
Businesses use it to test customer behavior patterns or preferences. The insights guide marketing and product decisions.
- In Manufacturing and Quality Control:
Companies use hypothesis testing to ensure consistency in their production processes.
- In Social Sciences:
Researchers apply it to understand societal trends or behavioral changes in populations.
V. Things to Keep in Mind
- Sample Size Matters:
A study with too few samples might lead to unreliable results. Most software tools offer power analysis features to help estimate the right sample size.
- Check Test Assumptions:
Every test has certain assumptions (like normal distribution, equal variances, etc.). Statistical software provides charts and diagnostics to check these easily.
- Interpreting Results:
Practical significance may not be represented by statistical significance. Software tools of visualization may facilitate the rendering of the results in a more logical and interpretable way.
VI. Advanced Techniques Worth Exploring
- Bayesian Hypothesis Testing:
Unlike the traditional approach, this method updates the probability of a hypothesis being true as new data comes in. Some statistical tools now support Bayesian analysis for greater flexibility.
- Combining with Machine Learning:
Most modern tools enable users to combine machine learning methods with traditional methods of hypothesis testing to produce more powerful and data-driven observations.
Conclusion
Learning how to conduct hypothesis testing using statistical software is an essential accomplishment that data analysis professionals must attain. Analyzing market or medical data, social patterns, or any other data is complicated but what makes it easier is the usage of such programs like SPSS or STATA which simplify the calculations and give the results accurate. If you're seeking reliable support, our SPSS Assignment Help, STATA Assignment Help, Data Analytics Assignment Help, Econometrics Assignment Help, and Machine Learning Assignment Help services are here to guide you. Let our experts make your hypothesis testing journey smooth, insightful, and academically rewarding.
About The Author:
- Name: Dr. Diego Ramirez
- Qualification: Master's in Data Science
- Bachelor's Degree: Dr. R. gets his principles in statistics after a very intensive Bachelor Degree course.
- Master's Degree: He continued with his studies and got a Masters Degree in advanced statistical methods which enhanced his understanding in the subject.
- Research Focus: His research focuses on making hypothesis testing methods more efficient by the use of statistical software to give better accuracy and reliability in the various fields of research.
- Expertise: Renowned as a highly knowledgeable professional, Dr. Ramirez effectively uses sophisticated statistical instruments and makes important contributions to both the theoretical and practical research areas.


