
- 26th Sep 2025
- 06:03 am
Have you ever looked at a scatter plot full of data points and wondered, “What’s the trend here?” That’s where the line of best fit comes in. Whether you’re tackling a statistics assignment, finishing up homework, or working on a data project, knowing how to draw and interpret the line of best fit will help you make sense of data patterns with ease. For students, the line of best fit is more than just a math concept—it’s a powerful way to simplify messy data, reveal hidden patterns, and make accurate predictions. And if you ever need statistics assignment help, homework support with regression, or guidance on a research project, mastering this topic will give you the confidence to handle data like a pro.
In this guide, we’ll explore what the line of best fit is, how to draw it, and—most importantly—how to interpret it with confidence.
What is a Line of Best Fit?
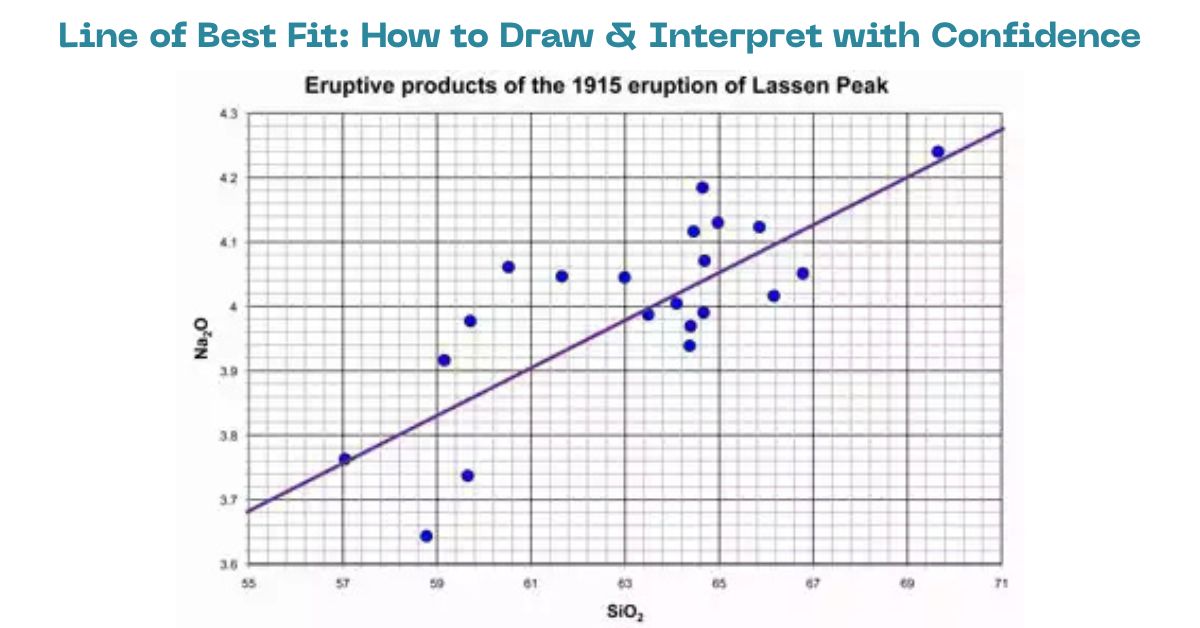
A line of best fit (also called a regression line or trendline) is a straight line that best represents the data on a scatter plot. It highlights the overall trend of the data points and makes it easier to see how two variables are related.
Example:
- If you plot hours studied vs. exam scores, the line of best fit will likely slope upwards, showing that more study hours are linked to higher scores.
- If you plot temperature vs. hot chocolate sales, the line may slope downward, indicating that sales drop as temperatures rise.
That’s why the line of best fit is such a valuable tool—not only for academic learning but also for real-world decision-making.From students working on projects to businesses analyzing sales and researchers making predictions, this simple yet powerful method proves useful to everyone.
Types of Lines of Best Fit
Although the term often refers to a straight line, there are actually different types of trendlines depending on the data:
- Linear Line of Best Fit – A straight line showing a constant rate of increase or decrease.
- Nonlinear (Curved) Line of Best Fit – Used when data doesn’t follow a straight pattern. Examples include quadratic or exponential trendlines.
- Multiple Regression Lines – When more than one variable affects the outcome.
For most student assignments and introductory statistics classes, the linear line of best fit is the most commonly used.
How to Draw a Line of Best Fit
1. Drawing by Hand
When solving homework or exam questions without software:
- Plot the data points on graph paper.
- Use a ruler to sketch a line that seems to go through the “middle” of the data.
- The line should have roughly equal points above and below it.
- This visual method is simple but can be subjective.
2. Statistical Method: Least Squares Regression
The most accurate way to find a line of best fit is through the least squares method.
- Equation of a line: y = mx + c
- m = slope (rate of change)
- c = intercept (value of y when x = 0)
- The method minimizes the sum of the squared differences (residuals) between the actual data points and the predicted values on the line.
This ensures that the line fits the data as closely as possible.
3. Using Tools and Software
If you need help with projects or research, digital tools make this process much easier:
- Excel/Google Sheets – Add a scatter plot → Insert trendline → Display equation & R² value.
- SPSS or Minitab – Built-in regression functions.
- R/Python – Use functions like lm() in R or scikit-learn in Python for regression.
Students often seek homework help with software-based regression analysis. Knowing how to use these tools will save you time and effort.
How to Interpret a Line of Best Fit
Once you have drawn the line, interpretation is the next step. Here’s what to look for:
1. Direction of the Line
- Positive slope → as x increases, y increases (e.g., study hours vs. grades).
- Negative slope → as x increases, y decreases (e.g., price vs. demand).
2. Strength of the Relationship
- Measured using the correlation coefficient (r) and coefficient of determination (R²).
- R² tells you how much of the variation in y is explained by x. For example, an R² of 0.8 means 80% of the outcome is explained by the model.
3. Predictions
The equation of the line can be used to make predictions.
- Example: If y = 5x + 10, and x = 8, then predicted y = 50.
- This is especially useful for assignments, projects, and case studies where students need to show how data can be applied to real-life problems.
4. Residuals
Residuals are the differences between actual data points and predicted values. Small residuals indicate a good fit.
Common Mistakes Students Make
- Trying to fit a straight line to data that clearly follows a curve.
- Ignoring outliers that can distort the line.
- Over-interpreting predictions beyond the range of available data (called extrapolation).
- Misunderstanding R² – A high R² doesn’t mean causation, only correlation.
If you are struggling with these concepts, getting statistics assignment help can save you from common errors and improve your grades.
Practical Applications of Line of Best Fit
The line of best fit isn’t just a classroom concept—it’s widely used in real life. Some applications include:
- Education – Predicting student performance based on study habits.
- Business – Forecasting sales, revenue, or customer behavior.
- Healthcare – Studying the effect of exercise on blood pressure.
- Economics – Analyzing trends in inflation, employment, or GDP.
- Engineering & Science – Estimating physical relationships such as speed vs. distance.
For students working on projects or dissertations, these applications show how theory connects with real-world problems.
Why Students Seek Help with Line of Best Fit
Many students find this topic challenging because it requires both mathematical skills and statistical reasoning. Common struggles include:
- Figuring out how least squares regression really works.
- Using software like Excel, R, or Python for analysis.
- Correctly interpreting R² and slope.
This is why many reach out for:
- Assignment Help – Step-by-step solutions to line of best fit problems.
- Homework Help – Guidance with tricky scatter plot and regression tasks.
- Help with Projects – Support in applying regression analysis to research or real-world datasets.
Getting professional assistance ensures accuracy, saves time, and boosts confidence in tackling statistics.
Conclusion
The line of best fit is one of the most important tools in statistics for analyzing data, identifying trends, and making predictions. Whether you are:
- Completing a homework assignment
- Working on a statistics project
- Or simply trying to understand data better
- —knowing how to draw and interpret the line of best fit with confidence is a must-have skill.
If you ever feel stuck, don’t hesitate to seek statistics assignment help. By working with expert tutors, you can stay on track with deadlines and strengthen your grasp of statistics at the same time. At The Statistics Assignment Help, we specialize in providing students with reliable homework help, project support, and assignment solutions—so you can succeed in your studies with confidence.


